New - 1 Hour Ago
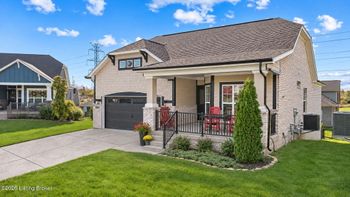
$555,500
Active
2
Beds
2
Baths
1814
Sqft
0.15
Acres
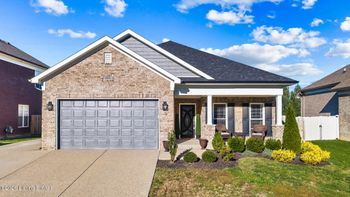
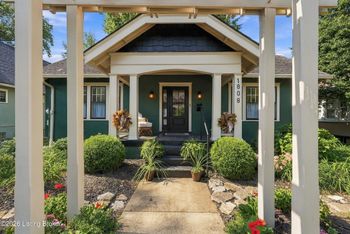
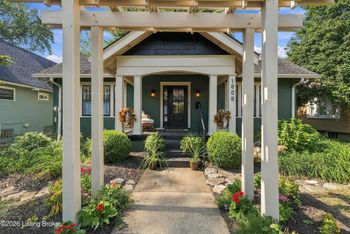
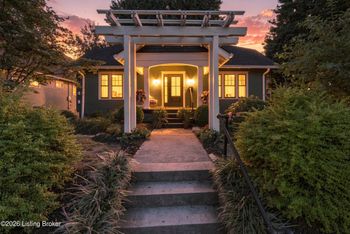
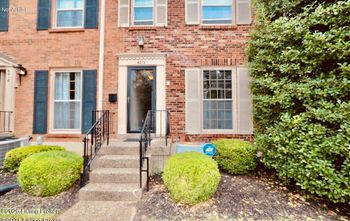
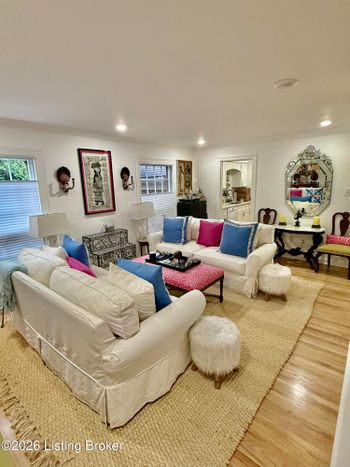
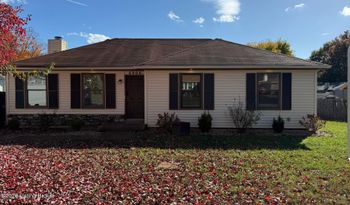
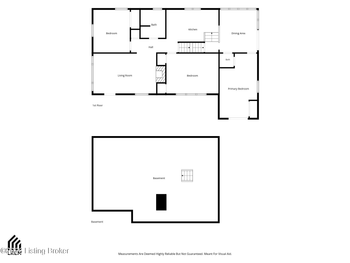
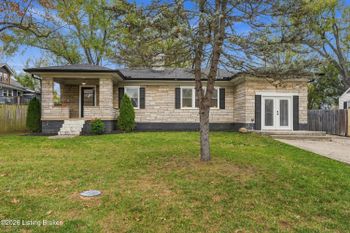
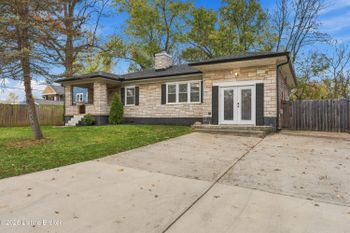
14206 Creel Cabin Way, Louisville, KY 40299
MLS#: 1734095


Below is a quick overview of the current Louisville real estate market. Numbers and statistics are gathered from the Greater Louisville Association of Realtors® (GLAR) for October 2026.
It is currently a Sellers Market. The absorption rate for October was 3.9 months. What is an absorption rate? This is an indication of how many months of inventory we currently have. You need between 4-6 months of inventory to be in a balanced market.
Are Home Prices Dropping in Louisville? Not yet. The median sale price in Louisville was $290,000 in October 2026, up 8.0% from $268,500 in October 2025. That’s the highest monthly median in the past two years. The average sale price rose a more modest 1.6%, to $340,985.
Prices are holding, but buyers have more room to negotiate. Homes sold for 97.8% of list price in October, down from 98.4% a year ago. Measured against the original list price, the figure was 96.0%, so more sellers are cutting their price before they get an offer.
Pending sales are down sharply heading into winter, so we expect prices to level off over the next few months rather than keep climbing.
What is Happening in the Market? Inventory is climbing fast. Louisville had 2,698 active listings in October 2026, up 41% from 1,916 a year ago. That’s more homes for sale than at any point in 2018 or 2019.
Buyer activity has slowed at the same time. Pending sales fell to 476, down 41% from October 2025, and closed sales dropped 22%, to 710. Homes now spend an average of 34 days on the market, up from 26 a year ago. If you count homes that were relisted, the average is 50 days.
The absorption rate has risen to 3.3 months, up from 2.0 in February. Louisville is still technically a seller’s market, but it is moving toward a balanced one.
Activity and showings overall are trending down, given the increase in inventory. The average number of showings per listing is 2.7, which is the lowest in more than 10 years.
October 2026 Louisville Housing Statistics
Homes right now are selling within 34 days on market. Over the years we have seen a great increase in home prices around Louisville. Right now may still be a great time for homeowners thinking about selling, provided the home is priced right from day one..