[Estimated read time: 4 minutes]
In this article, we dig deep into the local MLS statistics to find out when is the best time to buy a house in Louisville Kentucky.

The takeaway from this study was clear, we were able to get a great overlook on the Louisville real estate market and how it shifts throughout the year.
The Data
We looked at 10 years worth of statistics from the local MLS (2006-2016).
The data included:
⚬ Over 184k New Listings
⚬ Over 145k Sold Listings
We narrowed down the search criteria to only include:
⚬ Single Family Residence
⚬ Condominiums
⚬ and Patio Homes
After all of this research and gathering of data, noticeable trends stood out for median sale prices, days on market, new listings and more.
First, Why is Spring & Summer so Popular?
We always see the housing market pick up once the temperature starts to increase. Homeowners tend to make the move in the Spring and Summer months because it is a more convenient time to for the transition.
Of course, everyone's situation is different and unique but these are the three reasons that seem to be the most popular:
⚬ End of School Year
⚬ Warmer Temperatures
⚬ Relocating or New job position
Home Prices Usually Spike in...
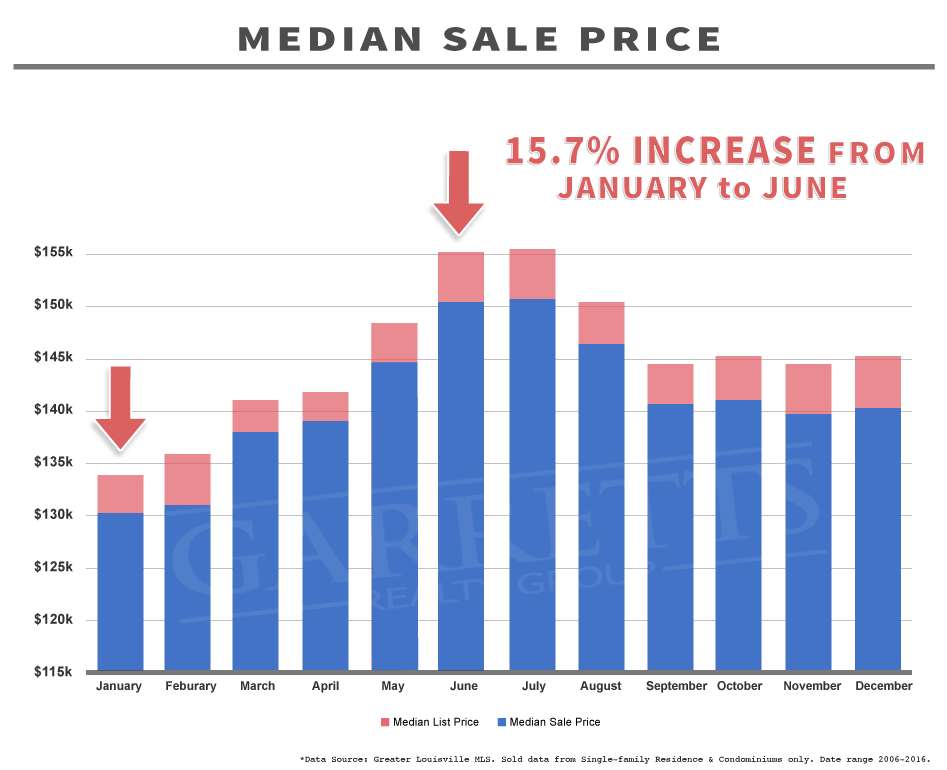
We noticed that the median sale price for the month of June and July is when the numbers spike. Telling us that this may not be the best time to buy a house if you are looking to find a great deal on a home.
In the bar graph below you will notice that the ten-year median sale price for the month of June is $150,593, the highest number on the graph.
Compare that to January, which is the lowest number on the graph at $130,188.
That is a 15.7% difference between the two months.
Waiting until a Slower Market?
In the graph above, you will also notice that the median sale price in the winter months is much lower compared to the summer months. Now, this could be a better time buy a house if you are looking for a 'discounted' price.
Pro: Less competition
Since more people wait until the middle of the year to make the move. There are fewer active buyers that you will have to 'compete' with. Which can help reduce the amount of tension and urgency that you may experience in a hot seller's market.
However, if you decide to start shopping for a home in the winter months, you will discover one downfall.
Con: There's less to choose from
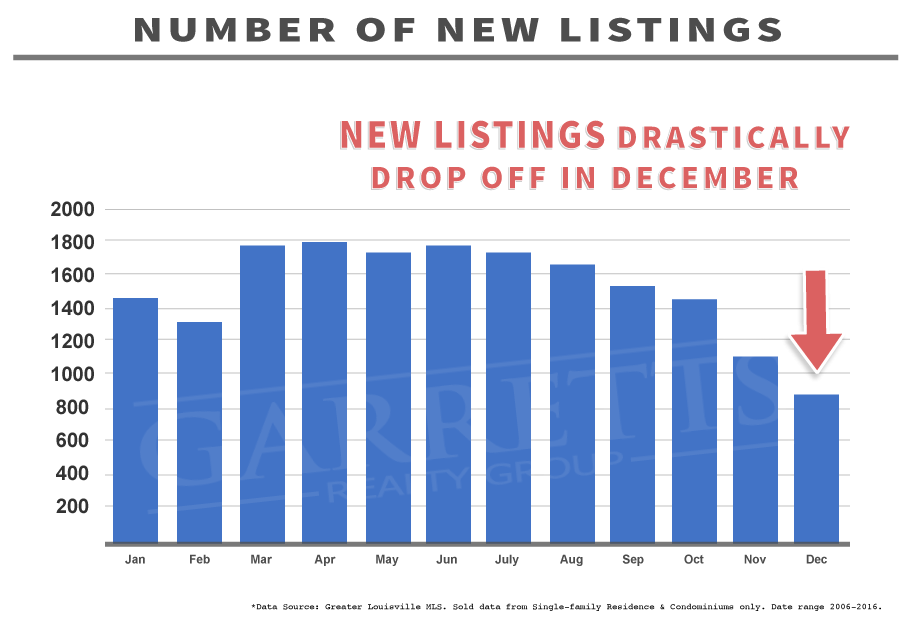
Take a look at the graph below. You will see that the average number of listings, over a ten-year period, really drop off in the month of December. Making it harder to find that dream home.
Compared to the month of March, when the number of listings jump up and hold steady through the summer and early fall.
DISCOUNT off the List Price
When wanting to know when is a good time to buy a house in Louisville, it's good to understand the List Price vs Sale Price ratio.
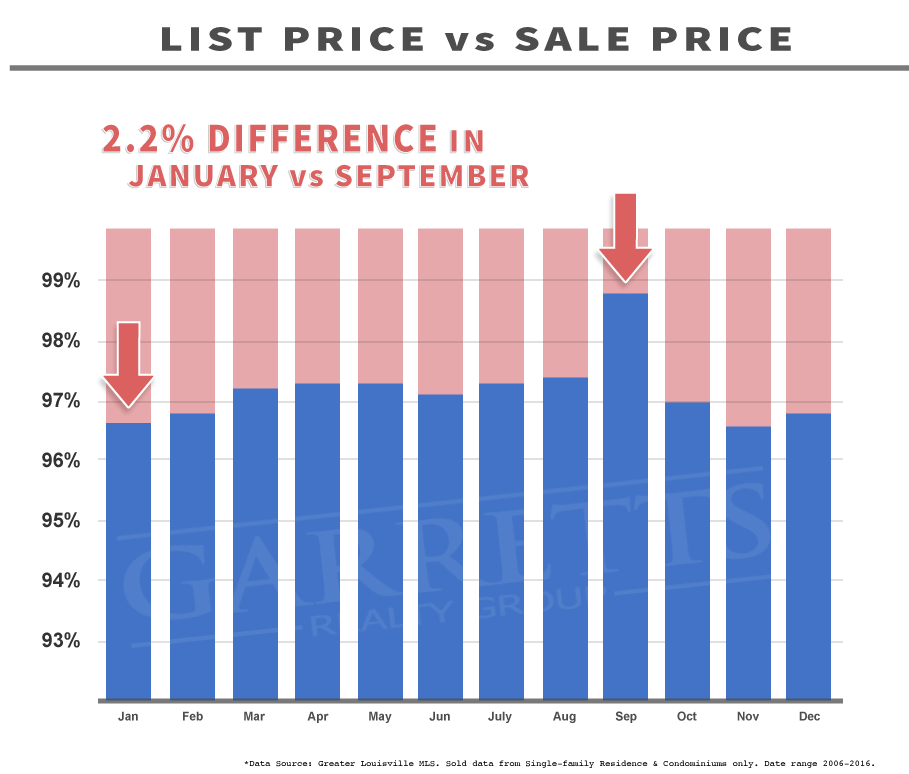
Below is a graph that illustrates what the List Price vs Sale Price average is for each month over the past 10-years. Simplified, the bar graph below shows you, what the percentage of the list price the Buyer pays for the property.
For an example:
If a Buyer pays 98% of the List Price on a $100,000 home. The sale price would be $98,000.
You will notice that in the month of January, there is a 3.4% difference between the listing price and sale price.
Compared to the month of September when there is only a 1.2% difference.
That is more than a two-percent difference!
Meaning a lot more money for a Seller if you buy a home in the month of September.
Finding Motivated Sellers
As agents here in the Louisville area, we notice the first wave of a slow down when the school calendar starts. To follow, we have holidays and colder temperatures that really bring the local real estate market to a crawl.
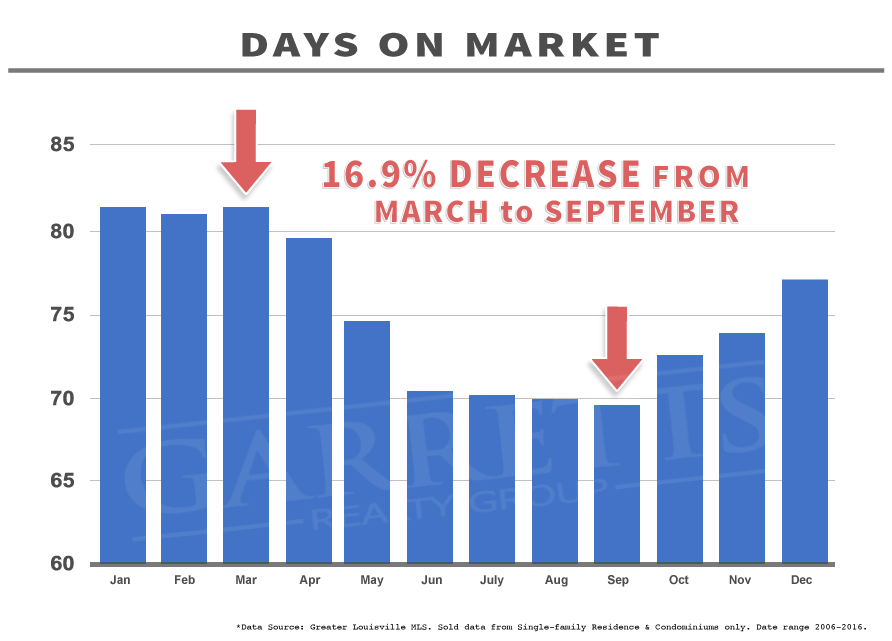
If you are looking for a good deal, one way to find a motivated seller is by checking the DOM. This is the time-frame in which a home is active on the market until a buyer comes along and the property goes under contract. Between the months of December and March, if you come across a home that has been on the market for 70+ days. You may be able to find a very motivated seller.
Already Bought a Home?
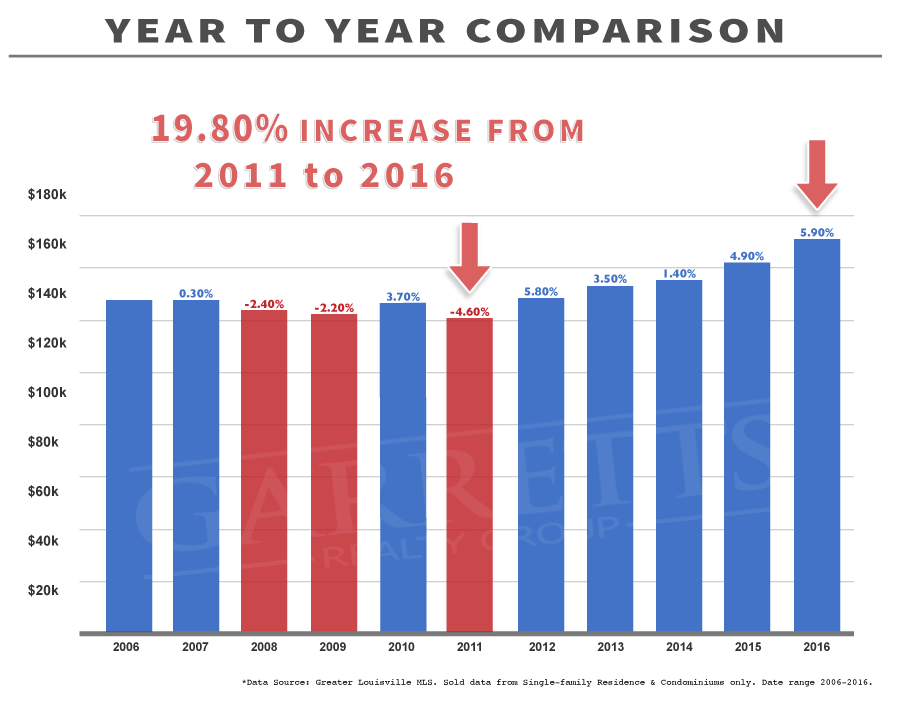
So you already bought a home. Let's look to see if your numbers match up to the statistics. In the bar graph below you will see a year to year comparison. Based upon the numbers gathered, if you bought a home in 2010, you may have taken a loss the following year.
However, if you purchased a home in 2011, you may have seen a significant increase in the market value of your home.
Based on this case study.
The median sale price for 2011 was $130,000.
Compared to the median sale price for 2016, which was $162,000.
That is almost a 20% increase in the market value of your home.
Downfall of Case Study
One downfall about the data is that closing dates vary from each transaction.
For an example:
If a home receives an accepted contract in the month of January it may not actually close until the following month. While on the other hand, another home may go under contract and close within the same month.
So this case study is not guaranteed to be completely accurate and results can easily vary between every transaction.
Posted by Nathan Garrett on
Leave A Comment